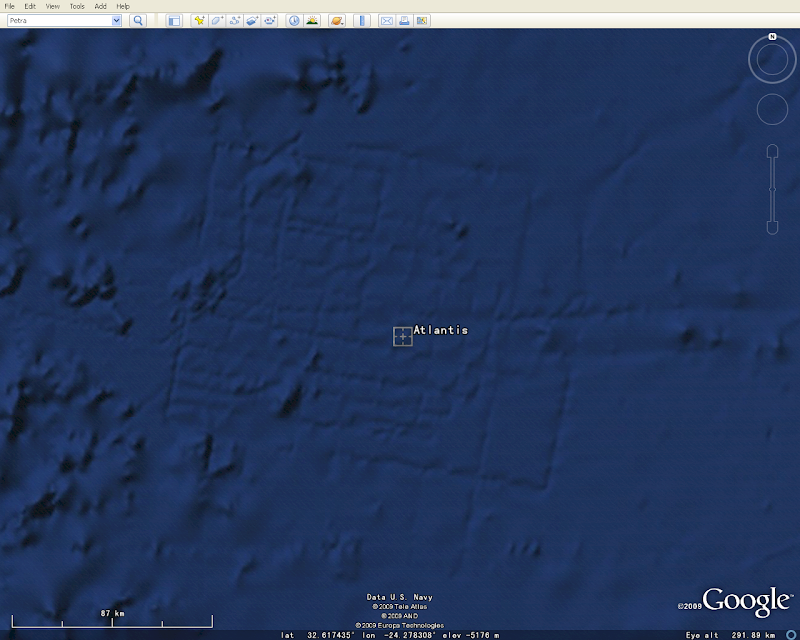
a Google spokesman noted that "what users are seeing is an artifact of the data collection process. Bathymetric (sea floor) data is often collected from boats using sonar to take measurements of the sea floor. The lines reflect the path of the boat as it gathers the data."[38] These lines are strips along which the bottom depth was directly measured by echosounding (sonar) surveys from ships. They show up as lines because the ocean bottom depth as estimated by satellite altimeter data has not been adjusted to fit the direct echosounding depth measurements.[39] The echosounding data were collected along the exact grid-like lines seen in Google Earth 5.0 during cruises concerned with collecting data for research evaluating the possibility for using the Madeira Abyssal Plain as a site for the disposal of radioactive waste.